
These docs are in progress. Some pages are incomplete or may change. Report a problem
Shapes and colours
Why DTPR's icons use hexagons, circles, rounded squares and octagons, what the colours mean, and how to keep them accessible.
Deployer docs menu
The research DTPR grew out of in 2019 produced a set of design principles. Those principles also set the rationale for the shapes, the colours and the approach to accessibility that the icons follow. This page explains that rationale.
Why hexagons?
The hexagon at the heart of DTPR takes its cue from the history of road signs. The original system, devised by the Mississippi Valley Association of State Highway Departments in 1923, tied the number of sides in a shape to the level of danger it signalled (Kohlstedt, 2020).
In that system, more sides meant more danger.
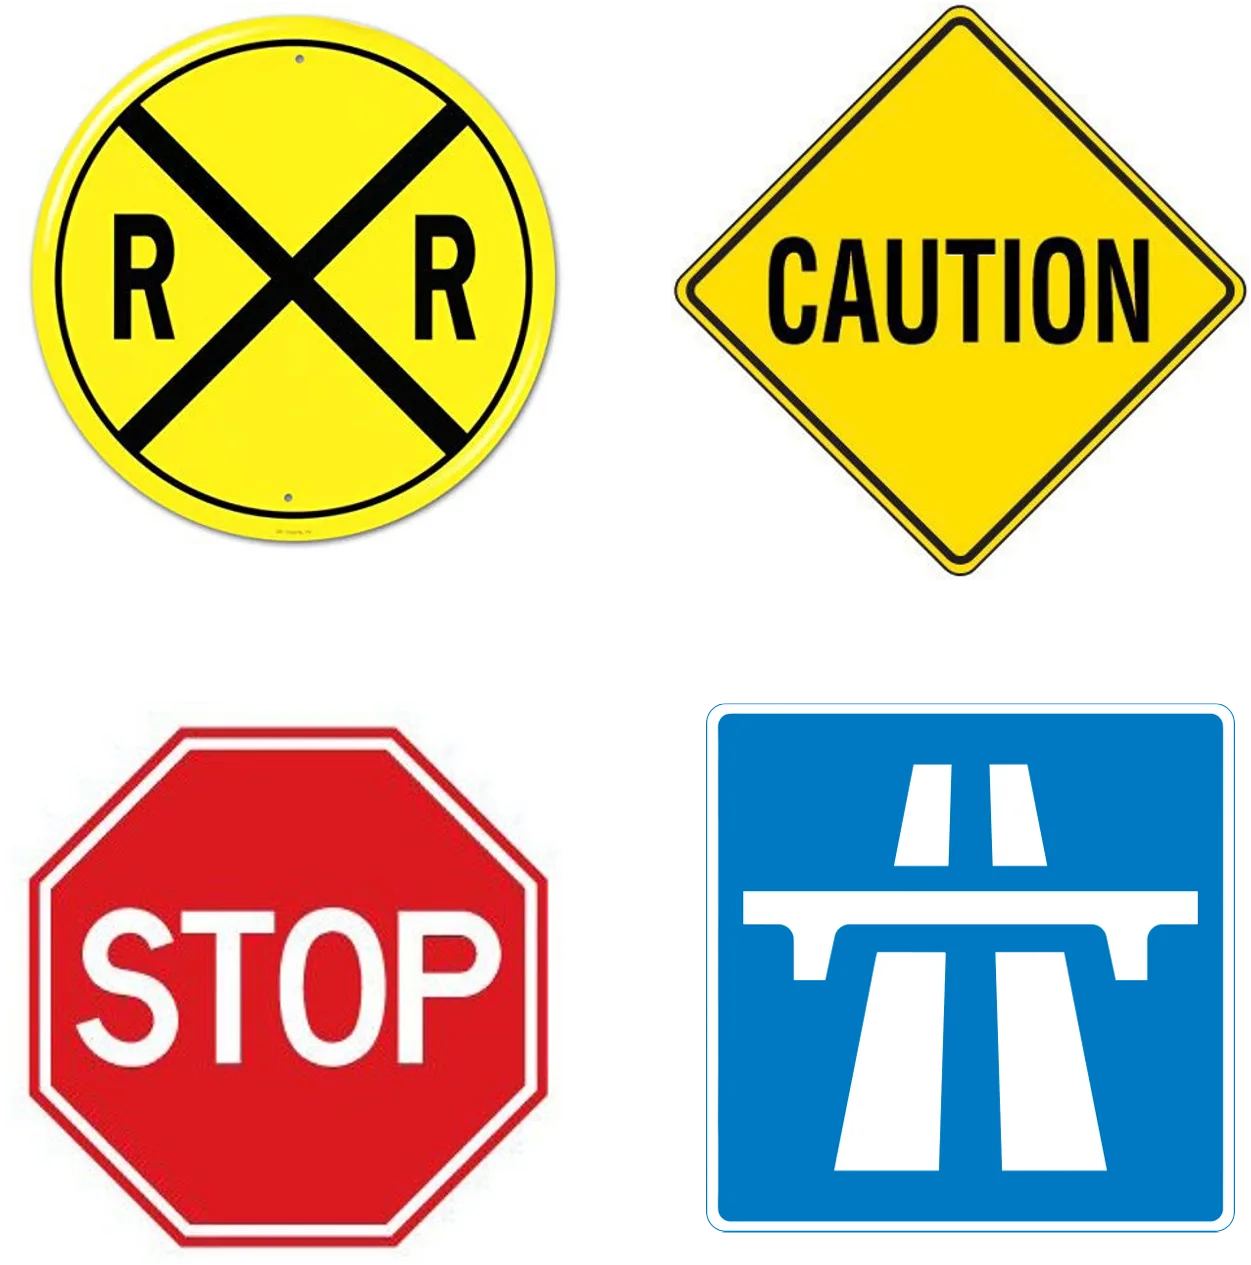
The circle, with its infinite number of sides, was reserved for the highest degree of danger, which is why it still marks railroad crossings. The octagon became the stop sign, a call for a high level of caution. Squares and rectangles were kept for signs that simply inform.
DTPR extends this idea. The hexagon sits between the octagon and the square: a shape that asks for attention and carries information at the same time. It is also a shape with a long association with technology, which helps it read as a marker for the systems DTPR describes.
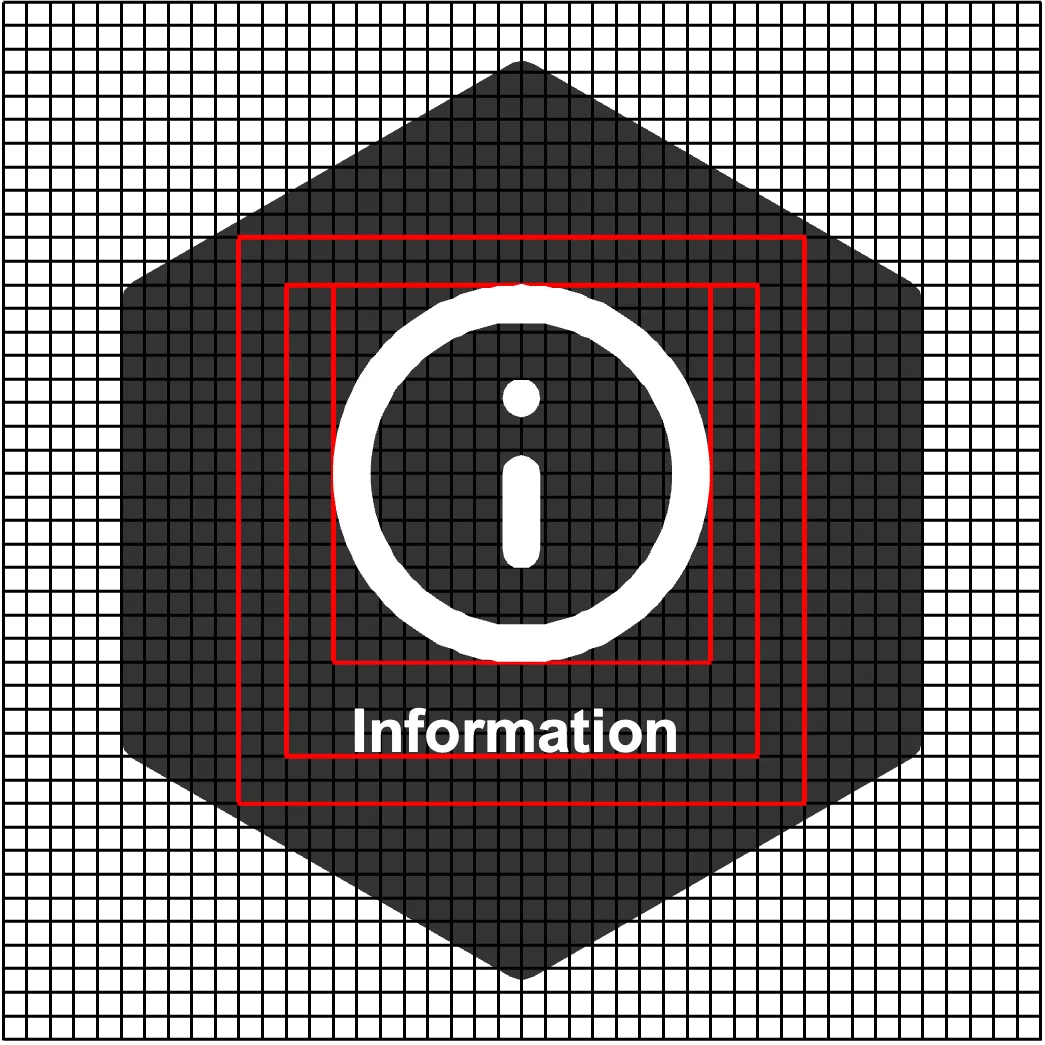
The four shapes
Following the same mental model, the other shapes were chosen to echo how shapes are read in public space. Each category of the taxonomy has one shape, so a reader can tell what kind of thing an element is before reading its title.
| Shape | Categories | What it signals |
|---|---|---|
| Hexagon | Purpose, Accountable, People affected, What it does, Collection Technology, Manifestation | The system itself: why it exists, who is involved, what it does, and the points where it meets the world |
| Circle | Input Data, Algorithm or Model, Output Data | Data in motion: what goes in, what processes it, and what comes out. The circle's unbroken line suggests a flow |
| Rounded square | Data Access, Data Retention, Data Storage | Data at rest: who can reach it, how long it is kept, and where. The square recalls a box or container, something that holds and safeguards |
| Octagon | Risks & Mitigation, Rights | Guardrails: what could go wrong and what you can do about it. The octagon borrows the stop sign's instruction to pause and check |
The Shape entry in Concepts lists the same pairings. They are a design convention; the schema does not enforce them.
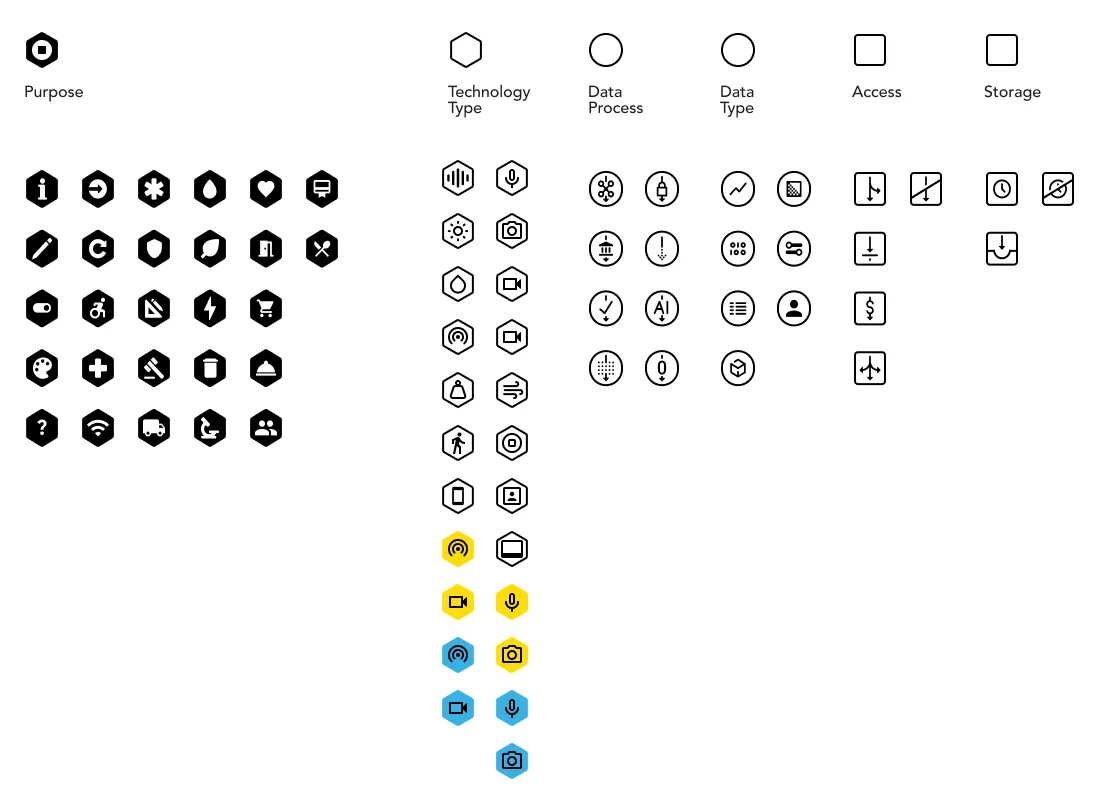
The DTPR logo is an amalgam of the shapes the system uses. The sheet below, from an earlier release, shows how the shapes and the layered icons came together. It predates the current palette and the current categories, so the colours and names on it differ from today's taxonomy.
Colours
Shared colour conventions let people read a sign quickly, whatever the context.
- Red almost everywhere means danger, emergencies and immediate action.
- Yellow signals caution and awareness. Its meaning depends more on context, and it is used where care is warranted.
- Green, blue, white and black usually mark signs that inform. They tend to feel calm, and they are the colours used to carry the most specific or detailed information.
Colour and DTPR
In DTPR, colour signals the nature of the data a system handles. User research is consistent on this: what people most want to know is whether a technology can identify them. So the Personal Information context value of an element in the Input Data or Output Data categories changes the colour of its icon:
- Yellow (
#FFD700): Identifiable data. The data contains a direct identifier, such as a name, an address, a recognisable face or voice or a plate number, or a token the system uses to look up who someone is. - Purple (
#9575CD): Pseudonymous data. Each person's data is tied to a token, such as a hash or an ID, that lets the system recognise the same person again without revealing a name. With extra information, they could be re-identified. - Blue (
#4A90D9): Anonymized data. The link to who the data is about is broken. It has been stripped of identifiers, blurred, aggregated or noised so the system cannot reasonably tie a record back to an individual.
Icons for elements that involve no personal data keep their default colouring. The Human involvement context in the What it does category also colours its values, so a reader can see at a glance how much of an action runs without a person. Every coloured icon has a matching variant for dark backgrounds.
Why use colour?
- Colour is social. People bring a rich set of meanings to it from their own experience and culture, and those existing associations can be put to work. Borrowing them makes a new convention, like DTPR, faster to learn.
- Colour is meaningful. Applied with care and consistency, it becomes part of how a design communicates: it makes the essential stand out and builds associations that help people understand similar information the next time they meet it.
Accessibility
Colour has to work for as many people as possible. These are the guidelines DTPR follows.
Contrast and light reflectance value
How legible a sign is depends heavily on contrast, which in turn depends on each colour's light reflectance value (LRV): how much light it reflects or absorbs. The Americans with Disabilities Act sets no minimum LRV, but industry practice is to keep a 70% contrast between the foreground and background colours of a sign.
Lighting
Ambient light changes how an interface reads. A web page with a black background can become unreadable outdoors in glare. Where possible, design signs and screens that stay readable across the lighting conditions people will actually meet them in.
Colour blindness
Roughly 8% of men and 0.5% of women have red-green colour blindness, so avoid relying on red and green together. DTPR's three data colours (yellow, purple and blue) stay apart for most forms of colour blindness, but colour should never be the only cue. Every icon carries its element's title, and signs should spell out in words whether personal data is involved, as the Sydney Olympic Park sign on the public signage page does.
Sources
Elliot, A. J., & Maier, M. A. (2007). Color and psychological functioning. Current Directions in Psychological Science, 16(5), 250–254. https://doi.org/10.1111/j.1467-8721.2007.00514
Fipps, K. (2023, June 8). The psychology behind colors and symbols in safety messaging. ISHN. https://www.ishn.com/articles/113745-the-psychology-behind-colors-and-symbols-in-safety-messaging
Kohlstedt, K. (2020, July 29). Red, white & sometimes blue: How safety shaped the octagonal stop sign. 99% Invisible. https://99percentinvisible.org/article/red-white-sometimes-blue-how-safety-shaped-the-octagonal-stop-sign/
U.S. Department of Health and Human Services. (2023, November). Color blindness. National Eye Institute. https://www.nei.nih.gov/learn-about-eye-health/eye-conditions-and-diseases/color-blindness
Wolfe, J. (2019, December 10). Importance of light reflectance value contrast for signage. ASI Signage. https://asisignage.com/2019/12/10/importance-of-light-reflectance-value-contrast-for-signage/